Research Article | | Peer-Reviewed

Reliability Assessment of Distribution Network for Improved Feeder Bule Hora University, West Guji, Oromiya Regional State, Ethiopia

Received: 26 January 2025     Accepted: 18 June 2025     Published: 28 July 2025
Views:       Downloads:
Abstract

The knowledge of the reliability of distribution networks and systems is important consideration in the system planning and operations for development and improvements of power distribution systems. To achieve the target as minimum interruptions as possible to customers, utilities must strive to improve the reliability but at the same time reduce cost. It is a known fact that most of customer interruptions are caused by the failure in distribution system and the data and statistics were not easy to collect the reliability performance. The objective of the study was to examine the reliability distribution of networks and systems in the study area. In terms of methods, these studies used analytical methods to determine the reliability indices and effect of distribution substation configuration and network to the reliability indices performance. The key findings showed that there is always uncertainty associated with the distribution network reliability in the study area. The authors concluded that for evaluation and analysis of reliability, having data on the number and range of the examined piece of equipment, it is important to have database for failure rates, repair time and unavailability for each component in distribution network. Finally, the authors recommended that in order to improve the present status of the reliability distribution of network for improved feeder, training of workers, experts and customers strategies are very necessary. So that planners, policy makers, local communities, stakeholders and households need strong coordination to achieve the objective.

Published in American Journal of Networks and Communications (Volume 14, Issue 2)
DOI 10.11648/j.ajnc.20251402.12
Page(s) 36-46
Creative Commons

This is an Open Access article, distributed under the terms of the Creative Commons Attribution 4.0 International License (http://creativecommons.org/licenses/by/4.0/), which permits unrestricted use, distribution and reproduction in any medium or format, provided the original work is properly cited.

Copyright

Copyright © The Author(s), 2025. Published by Science Publishing Group

Keywords

Customers, Reliability, Network, Power, Satisfaction, Bule Hora University, Ethiopia

1. Introduction
Power distribution network system established mainly to provide adequate electricity supply to customers as economically as possible with reasonable assurance of reliability. Nowadays, the power distribution networks have grown exponentially in term of size and technology over the past few years . As a result, utility company must strive to ensure that the customer’s reliability requirements are met with optimum strategic planning and lowest possible cost. The ability of the system to provide adequate supply of electricity energy determine by the term reliability .
Reliability analysis of distribution network is not a new topic in electric power industries, a lot of studies and research have been carried out due to the increasing cost of blackouts and fault outages . Over the past, distribution network system have received less attention devoted to reliability studies compared to generation and transmission system. The reasons being is the generation and transmission systems are capital intensive and the inadequacy can have widespread consequences for both society and environment . However, a distribution system is slightly cheaper compare to the other two because its effects are localized. Analysis of the customer failure statistics of most utilities shows that distribution system makes the greatest individual contribution to the unavailability of electrical supply to customer.
It is very important to assess and evaluate the reliability of power system networks in order to obtain the most accurate and effective way in decision making especially in planning, operation, and maintenance. Historical assessment and predictive methods are normally used to evaluate the reliability of a distribution network. Most utilities focus more on historical assessment rather than predictive methods. Predictive methods are categorized into analytical and simulation methods . Reliability assessment method for distribution system fall into two classes: simulation and analytical . Simulation is the most flexible method but require extensive time in computational and also uncertainty in precision. Analytical method can be further divided into network modeling and Markov modeling .
Network modeling has been the most popular technique for distribution system reliability analysis due to the simplicity of the method and natural similarities between network model and the distribution topology . The difference between simulation and analytical method is the way in which the system reliability indices are evaluated . By applying both analytical and simulation method, the reliability indices for distribution systems will be determined such as System Average Interruption Frequency Index (SAIFI) and System Average Interruption Duration Index (SAIDI).
The probability distribution of SAIFI and SAIDI which give information about the variability of the indices also need to obtain in order to improve in decision making. However, such important issue was not studied in Bule Hora University yet. Therefore, the specific objective of this study is (i) to assess the Reliability of Distribution Network Points in Bule Hora University, West Guji Zone, Oromiya Regional State, Ethiopia.
2. Materials and Methods
2.1. Description of the Study Area
Bule Hora (formerly Hagere Mariam, older, alternative names were Alga, Kuku) is a town located in West Guji Zone, Southern Oromiya Region State, Ethiopia. The study area is paved about 469 Km from the capital Addis Ababa-Moyale highway, in the West Guji Zone of the Oromia Region. It is the largest town in this zone mainly inhabited by the Guji communities of Oromiya Region. The study area is located between 50 11ꞌ 28ꞌꞌ - 50 18ꞌ 20ꞌꞌ N latitude and 37014ꞌ 00ꞌꞌ - 37019ꞌ 00ꞌꞌ E longitude. The study area is also bordered by Gedeo Zone Administration in the North and Amaro Zone Administration in the West. The altitudes of the study area range from 100 m asl in the west to 2,500m asl in the eastern highlands, with mean annual temperature and rainfall of 12-25°C and 700–1,300ml, respectively.
The study area has a favorable climate condition which is suitable for farming and animal husbandry activities. The rainfall distribution of the study area is bimodal (from March to May and from September to November. Some of the major cereals crops grown in the study area are Maize, Barely, wheat, and teff crops. Nitosols are the most dominant soil type covering the highest proportion of the study area. According to the soils in general are derived from volcanic rocks. 97% of the study population lives in rural areas and the rest 3% live in very small town centers.
Figure 1. Areal photograph of the study area.
2.2. Design
Multistage sampling techniques were applied for the study. The targeted study Town was selected purposively due to its reliability and familiarity by the author. The researcher employed both quantitative and qualitative approaches. The quantitative data was collected from systematic random selected academic staffs respondents of Bule Hora University via questionnaire while qualitative data was collected from key informant interviews (KII) and focus group discussion (FGD) of participants of administration unit members of the university and different customers.
2.3. Source of Data
In order to meet the dedicated objectives of study, the researcher used both primary and secondary sources of data. The primary data was collected from household survey, focus group discussion, key informant interview, and personal observation. The secondary sources included documents, reports, research reports, books, published journals and newspapers were important secondary source of data.
2.4. Target Population and Sample Size Determination
Bule Hora University, the study University, has a total targeted population of 5,206 including Deans, teachers, administrative unit employees, electric power user customers including town and village resident respondents. Finally, the sample size was determined based on the formula proposed by as follows
=N1+Ne2
=52261+ 5226(0.1)2
=52261+5226(0.01)
=522653.26 = 98
where n = the required sample size
N = total households population
e = error limit
Therefore the complete survey of the study was administered on 98 respondents for the major data survey through questionnaire.
Table 1. List of population categories, proportion of categories and sizes of selected sample respondents.

Name of the study Universiy

Population categories

population size of each categories

Purposively Selected sample sizes from each categories
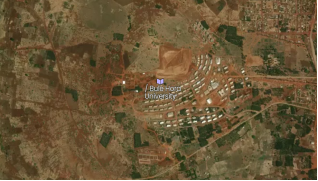
Bule Hora University

Deans

4

1

Academic staff (teachers)

3,141

57

Administrative unit (employees)

2,061

30

customers

20

10

Total population

5,226

98

Source: Bule Hora University and Kebele offices (2023/24)
2.5. Sampling Technique
The study was used multistage sampling methods. The researcher decided to employ systematic random sampling method to select academic staff (teachers), administrative employees units and deans. Therefore, to select a total of 98 sample respondents whose name was listed in the in the university, the researcher used systematic random sampling method as follows.
Kth=N/n
Where
kth = every respondent to be selected from the list
N = Total population (teachers and employees) in the University
n = The required sample sizes
Kth = 5226/98
Kth = 53.3 approximately = 53 Therefore, every kth (starting from the 1st listed name in the University) the 98 sample survey respondents were selected from their list systematically using standard formula adopted . However, random sampling method was used to select customers because it is not possible to get their name list in the university.
2.6. Data Analysis Methods
The collected data was analyzed with the help of Tables, graphs, charts, frequency distributions and percentages to give a condensed picture of the data-results. Finally, the data was analyzed using quantitatively and qualitatively and interpreted based on the conclusions and findings.
3. Results and Discussion
3.1. Socio-economic Characteristics of Sample Respondents
The average family size for each individual in the study areas was found to be 4.0. The stastical analysis result revealed that the educational background of the sampled households constituted 41%. Based on the results of the survey, about 88.33% of the study communities engaged in mixed agricultural activities. This result implies that agriculture is the primary economic backbone of the study communities.
The study area is found in West Guji zone where Bule-Hora University is located. The major crops which are grown in the study zone include, maize, and teff crops mainly cultivated for consumption. All these are grown during the long rainy season (March to November). Beside to crop production, livestock rearing is the other secondary agricultural activity undertaken by respondents and the main livestock types that are commonly kept in the study areas which include: poultry, sheep, goat, ox, and cow. 96% of the study community’s source of livelihood is mixed farming system (Figure 2). 81% of the FGD participants and 94% of the KII also realized that their main source of livelihood of the study communities is mixed farming system followed by livestock rearing and crop production (Figure 2).
Figure 2. Major livelihood sources of the study communities.
3.2. The Concept of Distribution System Reliability
The function of an electric power system is to satisfy the system load requirement with a reasonable assurance of continuity and quality. The ability of the system to provide an adequate supply of electrical energy is usually designated by the term reliability. The concept of power-system reliability is extremely broad and covers all aspects of the ability of the system to satisfy the customer requirements. There is a reasonable subdivision of the concern designated as system reliability which is shown in Figure 3.
Figure 3. System Reliability Sub-divisions.
Adequacy: Relates to the existence of sufficient facilities within the system to satisfy the consumer load demand. These include
1) The facilities necessary to generate sufficient energy and
2) The associated transmission and distribution facilities required to transport the energy to the actual consumer load points.
Security: Relates to the ability of the system response to disturbances arising within that system. Security is therefore associated with the response of the system to whatever perturbations it is subject to.
3.3. Reliability Indices for Distribution System
To measure system performance, the electric utility of Bule Hora University has developed several performance measures of reliability. These reliability indices include measures of outage duration, frequency of outages, system availability, and response time.
3.3.1. The Common Distribution Reliability Indices
The most common distribution reliability indices include the System Average Interruption Duration Index (SAIDI), Customer Average Interruption Duration Index (CAIDI), System Average Interruption Frequency Index (SAIFI), Momentary Average Interruption Frequency Index (MAIFI), Customer Average Interruption Frequency Index (CAIFI) Customers Interrupted per Interruption Index (CIII), and the Average Service Availability index (ASAI). Each of these the main indices will be discussed below one by one.
(i). System Average Interruption Frequency Index (SAIFI)
SAIFI is measure of how many sustained interruptions on average customer will experience over the course of a year. For a fixed number of customers, the only way to improve SAIFI is reduce the number of sustained interruption experienced by customers .
SAIFI=totalnumber of customerinterruprtiontotal number of customer served = λiNiNT
Where
𝛌i=number of interruptions at load point
Ni= number of customers connected to load point
NT = Total number of customers
(ii). System Average Interruption Duration Index (SAIDI)
SAIDI is a measure of how many interruption hours on average customer will experience over the course of a year. For a fixed number of customers, SAIDI can be improved by decreasing the number of interruptions or by decreasing the duration of these interruptions. Since both of these reflect reliability improvements, a reduction in SAIDI means an improvement in reliability .
SAIDI=sum of customer interrutions durationstotal number of customers = λiNiNT
SAIDI =SAIFI CAIDI
Where,
𝛌i = Restoration time, minutes.
Ni = Total number of customers interrupted
NT = Total number of customers
(iii). Customer Average Interruption Duration Index (CAIDI)
CAIDI is a measure of how long an average interruption lasts, and is used as a measure of utility response time to system incidents. CAIDI can be improved by decreasing the length of interruptions, but can also be decreased by increasing the number of short interruptions. As a result, a decrease in CAIDI does not necessarily mean an improvement in reliability .
CAIDI=sum of customer interrutions durationstotal number of interruptions = UiNiλiNi
CAIDI=SAIDISAIFI
Ui= Restoration time, minutes.
Ni = Total number of customers interrupted
(iv). Customer Average Interruption Frequency Index (CAIFI)
Similar to SAIFI is CAIFI, which is the Customer Average Interruption Frequency Index. The CAIFI measures the average number of interruptions per customer interrupted per year. The CAIFI is,
CAIFI= NONi
Where
No = number of interruptions
Ni= Total number customers interrupted
(v). Customer Interrupted per Interruption Index (CIII)
Customer Interrupted per Interruption Index (CIII) gives the average number of customers interrupted during an outage. It is the reciprocal of the CAIFI and is,
CIII=NiNo
Where
No = Number of interruptions
Ni = Total number of customers interrupted
(vi). Average Service Availability Index (ASAI)
The Average Service Availability Index (ASAI) is the ratio of the total number of customer hours that service was available during a given time period to the total customer hours demanded. This is sometimes called the service reliability index. The ASAI is usually calculated on either a monthly basis (730 hours) or a yearly basis (8,760 hours), but can be calculated for any time period. The ASAI is found as,
ASAI=[1- ri*NiNT*T]*100
Where,
T = Time period under study, hours.
ri = Restoration time, hours
Ni = Total number of customers interrupted
NT = Total number of customers served
This calculation, the restoration time, ri, is in hours instead of minutes. Another way of looking at ASAI on an annual basis is,
ASAI=8760-ASIDI8760*100
(vii). Total Energy Not Supplied (ENS)
The ENS (Total energy not supplied) is the sum of each load times its outage duration:
ENS=L*ri(Kwh/yr)
Where
L=Load (KW)
ri= Outage Duration
(viii). Average Energy Not Supplied (AENS)
AENS (Average Energy Not Supplied) can be calculated by dividing the ENS and the total number of customers:
AENS=Total Enery not supplidNumber of Customers(KWh/custoeryr)
Note: A customer here is defined as an electric meter, which can be an individual customer, a commercial entity or organization etc.
3.3.2. Reliability Assessment of Distribution System
Reliability assessment of a distribution system usually implicates evaluating the system's ability to consistently deliver power to customers without disturbances. This valuation often uses various reliability indices to measure the frequency and duration of outages, as well as the accessibility of service to customers. Mutual indices include SAIFI, SAIDI, CAIDI, and ASAI. The assessment can also involve finding areas for enhancement, such as applying strategies like distributed generation or network reconfiguration.
Reliability assessment is of primary importance in designing and planning distribution systems that operate in an economical method with slight interruption of customer loads.
3.4. Calculation on February Reliability Indices for Bule Hora University
Representation of the above outage identification is as flows Institute of technology (IoT), Administration building, Techno library, Low library, Social science library, Male dormitory, Female library, Student cafeteria, Main Hale, Teaching cafeteria and Staff residential blocks.
From the above Table 1, calculation of reliability indices for the specified time period, where ten outages have been recorded for the utility. The utility has a total of 45,000 customers.
Week one
Table 2. Reliability indices of Bule Hora University (1/07/20- 7/07/20, March 2020/21).

Outage identification

Number of customers

Duration (minute)

Customer-hours

1

120

0.25

0.5

2

200

0.25

0.833

3

40

0.25

0.167

4

24

0.25

0.1

5

36

0.25

0.15

6

1200

0.25

5

7

2000

0.25

8.33

8

160

0.25

0.67

9

8

0.25

0.033

10

72

0.25

0.3

All

3860

16.1

Source: Field survey result (2024)
Solution: The customer-hours are calculated for each outage and then they are summed for a total of 16.1 customer-hours or 996 customer-minutes.
Customer-minutes=16.1*60=996minutes
SAIFI=totalnumber of customerinterruprtiontotal number of customer served = λiNiNT =3860/45,000=0.0858
The customer-hours are calculated for each outage and then they are summed for a total of 16.1 customer-hours or 966.00 customer-minutes
SAIDI=sum of customer interrutions durationstotal number of customers = λiNiNT =966/45000=0.021min
SAIDI=0.021*1/60 =0.000035 Hrs it is not reliable, because the value of SAIDI for reliable system is between 1.5 to 3 Hrs.
The customer-minutes are 996 and 3856 customers were interrupted.
CAIDI= 9663860=0.26 Min
CAIFI is evaluated as ratio between four events and 3856 customers’ interrupted. It gives the average number of interruptions for a customer who was interrupted.
CAIFI=10/3860=0.0026
Customer Interrupted per Interruption Index (CIII)
Gives the average number of customers interrupted during an outage. It is the reciprocal of the CAIFI and is,
CIII=NiNo=386010=386
Average Service Availability Index (ASAI)
ASAI=8760-ASIDI8760*100
ASAI=  8760-0.000358760*100=99.999%
Week two
Reliability indices Bule Hora University (8/06/20- 14/06/20 on February 2020).
There were not any disturbance duration of interruption was zero Hours.
Week three. Reliability indices of Bule Hora University (15/06/20- 21/06/20 on February 2020).
Table 3. Reliability indices of Bule Hora University (1/07/20- 7/07/20, March 2020).

Outage identification

Number of customers

Duration (minute)

Customer-hours

1

120

15.923333

31.85

2

200

15.923333

53.1

3

40

15.923333

10.62

4

24

15.923333

17

5

36

15.923333

9.554

6

1200

15.923333

318.47

7

2000

15.923333

530.1

8

160

15.923333

42.46

9

8

15.923333

2.12

10

72

15.923333

19.11

All

3860

1034.384

Source: Field survey result (2020/21)
Solution; Customer- minutes = 1034.384 *60= 62,063.04
SAIFI=totalnumber of customerinterruprtiontotal number of customer served = λiNiNT =3680/45000=0.0856
The customer-hours are calculated for each outage and then they are summed for a total of 1034.384 customer-hours or 62,063.04 customer-minutes.
SAIDI=sum of customer interrutions durationstotal number of customers = λiNiNT =62063/45000=1.38min
SAIDI=1.38*1/60 =0.023 Hrs it is not reliable, because the value of SAIDI for reliable system is between 1.5 to 3 Hrs.
The customer-minutes are 62063.04 and 3860 customers were interrupted.
CAIDI= 62063.043860=16.01 Min
CAIFI is evaluated as ratio between four events and 3860 customers’ interrupted. It gives the average number of interruptions for a customer who was interrupted.
CAIFI=10/3860=0.0026
Customer Interrupted per Interruption Index (CIII)
Gives the average number of customers interrupted during an outage. It is the reciprocal of the CAIFI and is,
CIII=NiNo=386010=386
Average Service Availability Index (ASAI)
ASAI=8760-ASIDI8760*100
ASAI=  8760-0.023 8760*100=99.999%
Week four
Reliability indices of bule hora University (22/06/20- 30/06/20 on February 2020).
During 22/06/20- 30/06/20 this time, there were no Interruptions faced (zero Hrs duration of interruptions).
3.5. Calculation Reliability Indices for Bule Hora University (March, 2024)
Week one
Table 4. Reliability indices of Bule Hora University (1/07/20- 7/07/20, March 2020).

Outage identification

Number of customers

Duration (minute)

Customer-hours

1

120

6.36

12.72

2

200

6.36

21.2

3

40

6.36

4.24

4

24

6.36

2.544

5

36

6.36

3.816

6

1200

6.36

127.2

7

2000

6.36

212

8

160

6.36

16.96

9

8

6.36

0.848

10

72

6.36

7.632

All

3860

409.16

Source: Field survey result (2024)
Solution: Customer- minutes = 409.16 *60= 24549.6 minutes
SAIFI=totalnumber of customerinterruprtiontotal number of customer served = λiNiNT =3860/45,000=0.0858
The customer-hours are calculated for each outage and then they are summed for a total of 409.16 customer-hours or 24549.6 customer-minutes.
SAIDI=sum of customer interrutions durationstotal number of customers = λiNiNT =24549.6/45000=0.5455min
SAIDI= 0.5455 *1/60 =0.0091 Hrs it is not reliable, because the value of SAIDI for reliable system is between 1.5 to 3 Hrs.
The customer-minutes are 24549.6 and 3860 customers were interrupted.
CAIDI= 24549.63860=6.36 Min
CAIFI is evaluated as ratio between four events and 3860 customers’ interrupted. It gives the average number of interruptions for a customer who was interrupted.
CAIFI=10/3860=0.0026
Customer Interrupted per Interruption Index (CIII)
Gives the average number of customers interrupted during an outage. It is the reciprocal of the CAIFI and is,
CIII=NiNo=386010=386
Average Service Availability Index (ASAI)
ASAI=8760-ASIDI8760*100
ASAI=  8760-0.00918760*100=99.999%
Week two
Table 5. Reliability indices of bule hora University (8/07/20- 15/07/20, March 2020).

Outage identification

Number of customers

Duration (minute)

Customer-hours

1

120

1.62

3.24

2

200

1.62

5.4

3

40

1.62

1.08

4

24

1.62

0.648

5

36

1.62

0.972

6

1200

1.62

32.4

7

2000

1.62

54

8

160

1.62

4.32

9

8

1.62

0.216

10

72

1.62

1.944

All

3860

104.22

Source: Field survey result (2024)
Solution: Customer- minutes = 104.22 *60= 6253.2
SAIFI=totalnumber of customerinterruprtiontotal number of customer served = λiNiNT =3860/45,000=0.0858
The customer-hours are calculated for each outage and then they are summed for a total of 104.22 customer-hours or 6253.2 customer-minutes.
SAIDI=sum of customer interrutions durationstotal number of customers = λiNiNT =6253.2/45000=0.139min
SAIDI=0.139 *1/60 =0.002316 Hours it is not reliable, because the value of SAIDI for reliable system is between 1.5 to 3 Hrs.
The customer-minutes are 996 and 3860 customers were interrupted.
CAIDI= 6253.23860=1.62 Min
CAIFI is evaluated as ratio between four events and 3860 customers’ interrupted. It gives the average number of interruptions for a customer who was interrupted.
CAIFI = 10/3860= 0.0026
Table 6. Reliability indices of Bule Hora University (15/07/20- 21/07/20, March 2020).

Outage identification

Number of customers

Duration (minute)

Customer-hours

1

120

7.78

15.56

2

200

7.78

25.93

3

40

7.78

5.1867

4

24

7.78

3.112

5

36

7.78

4.668

6

1200

7.78

155.6

7

2000

7.78

259.333

8

160

7.78

20.7467

9

8

7.78

1.0373

10

72

7.78

9.336

All

3860

500.5106

Source: Field survey result (2024)
Solution: Customer- minutes = 500.5106 *60=30030.636
SAIFI=totalnumber of customerinterruprtiontotal number of customer served = λiNiNT =3860/45,000=0.0858
The customer-hours are calculated for each outage and then they are summed for a total of 500.5106 customer-hours or 30030.636 customer-minutes.
SAIDI=sum of customer interrutions durationstotal number of customers = λiNiNT =30030.636/45000=0.667min
SAIDI=0.667 *1/60 =0.011122458 Hours it is not reliable, because the value of SAIDI for reliable system is between 1.5 to 3 Hrs.
The customer-minutes are 30030.636 and 3860 customers were interrupted.
CAIDI= 30030.6363860=7.78 Min
CAIFI is evaluated as ratio between four events and 3860 customers’ interrupted. It gives the average number of interruptions for a customer who was interrupted.
CAIFI = 10/3860= 0.0026
Week four
Reliability indices of Bule Hora University (22/07/20- 30/07/20 on March 2020). There were not any disturbance duration of interruption was zero Hours. SAIDI is calculated for each week, the monthly SAIDI is calculated by sum of the weekly values.
3.6. Observation
The following observations can be summarized from reliability analysis:
1) Reliability indices (SAIDI, CAIDI and ENS) will not be improved if the Distribution Generation (DG) unit is installed at the distribution substation regardless of the DG size. This is because the failures in any section or distributor lateral within the circuit will not be mitigated as the DG unit will just act as an additional source to the distribution substation. However, in case of power interruptions from the main substation, the DG can be used to supply power to the system.
2) Reliability indices (SAIDI, CAIDI and ENS) improve as the DG is installed away from the substation and closer to the loads.
3) The best improvement is observed when the DG is placed at the end of the line.
4. Conclusion and Recommendation
This research paper presented the analysis of reliability with the inclusion of distribution generation. The different distribution system reliability indices such as SAIFI, SAIDI, CAIDI CAIFI, before distribution generation integration (base case) and the case when distribution generation is connected to the distribution system were compared. The result showed that by installing distribution generation with proper size and location of Bule-Hora university distribution system reliability was increased by 2 times. The other result also indicated that distribution system reliability indices depend on both the size and location of distribution generation in the distribution system which implies that reliability distribution network point is necessary for Bule-Hora University, South Ethiopia. Finally, the author recommended that both the location of distribution generation and the capacity of distribution generation must take into account to reach optimal condition in order to create the suitability and fairness for both utility and distribution generation.
Author Contributions
Kumilachew Chane is the sole author. The author read and approved the final manuscript.
Funding
There are no any funding organizations and individuals for this article.
Data Availability Statement
The data used in this analysis are available with the corresponding author upon request.
Conflicts of Interest
The authors declare no conflicts of interest.
References
[1] Alemayehu, D., & Gobena, A. (2019). Historical survey of Bule Hora Town from its Foundation to Present. Journal of Indigenous Knowledge and Development Studies, 1(1), 44-65.
[2] Anthony J. Pansini, Guide to Distribution Systems, the Fairmont Press, Inc. 2005.
[3] Celli, G., Ghiani, E., Pilo, F., & Soma, G. G. (2013). Reliability assessment in smart distribution networks. Electric Power Systems Research, 104, 164-175.
[4] Chandel, A. S. (2024). Geo-spatial technology based on a multi-criteria evaluation technique used to find potential landfill sites in the town of Bule Hora in southern Ethiopia. Journal of the Air & Waste ManagementAssociation, 74(4), 207-239.
[5] E. T. N, Power Distribution Systems, Sheet 01004, 201.
[6] Ejigu, G., Leta, B., & Abebaw, A. (2020). 1. Department of Chemistry, College of Natural and Computation Science, Bule Hora University, Bule Hora, Ethiopia 2. Departments of Chemistry, College of Natural and Computation Science, Ambo University, Ambo, Ethiopia.
[7] Glenn, I. (1992). Sampling and evidence of extension program impact. Program evaluation and organization Development, IFAS, University of Florida.
[8] Gonfa, D. B. Department of Accounting and Finance, College of Business and Economics, Bule Hora University, Bule Hora, Ethiopia.
[9] H. Mokhtari, et al, Power Quality Survey in a Distribution System, Standard Procedures and Limitations, Sharif University of Technology, Azadi Ave., Tehran, Iran.
[10] Hongyun Zhang, Pengxiang Bi, “Development and Application of Reliability Analysis System for Medium and High Voltage Distribution Networks”, DRPT2008 6-9, China, 2018.
[11] Jahangiri, P., & Fotuhi-Firuzabad, M. (2008, December). Reliability assessment of distribution system with distributed generation. In 2008 IEEE 2nd International Power and Energy Conference (pp. 1551-1556). IEEE.
[12] Josnicjusz Nazarko, Modeling of Electrical Power Distribution Systems by Application of Experimental Design, IEEE, University of Finance and Management, Bialystok, Poland, 2000.
[13] Kothari, C. R. (2004). Research design Methodology. (2nd Eds). New Delhi: New Sag.
[14] Lingyun Wang, Feeder Performance Analysis with Distributed Algorithm, Virginia Polytechnic Institute and State University Blacksburg, Virginia, 2011.
[15] M. R Emjedi, K. Awodele, S. Chowdhury, S. P. Chowdhury, Reliability Mustafa Aziz, Modern Power Distribution Systems for Utilities, Haward Technology.
[16] Richard E. Brown, Electric Power Distribution Reliability, Second Edition, 2004.
[17] Roy Billinton, Ronald N. Allan, Reliability Evaluation of Power System, Second Edition, 2018.
[18] Stephen W. Fardo, Dale R. Patrick, Electrical Power Systems Technology, Third Edition, The Fairmont Press, Inc., United States of America, 2009.
[19] Tempa Dorji, Reliability Assessment of Distribution Systems, Norweigan University of Science and Technology (NTNU), 2009.
[20] Turan Gonen, Electrical Power Distribution System Engineering, United States of America, McGraw-Hill Series in Electrical Engineering, 1986.
[21] W. Peng and R. Billinton. Reliability benefits analysis of adding WTG to a distribution system: IEEE Trans. Energy Conversion, 16(2): 134-139, Jun 2001.
[22] W. L. Kling, Intelligent Distribution Network Design; ISBN: 978-90-386-1974-3 Printed by JP Tamminga, Duiven, 2009.
Cite This Article
  • APA Style

    Chane, K. (2025). Reliability Assessment of Distribution Network for Improved Feeder Bule Hora University, West Guji, Oromiya Regional State, Ethiopia. American Journal of Networks and Communications, 14(2), 36-46. https://doi.org/10.11648/j.ajnc.20251402.12

    Copy | Download

    ACS Style

    Chane, K. Reliability Assessment of Distribution Network for Improved Feeder Bule Hora University, West Guji, Oromiya Regional State, Ethiopia. Am. J. Netw. Commun. 2025, 14(2), 36-46. doi: 10.11648/j.ajnc.20251402.12

    Copy | Download

    AMA Style

    Chane K. Reliability Assessment of Distribution Network for Improved Feeder Bule Hora University, West Guji, Oromiya Regional State, Ethiopia. Am J Netw Commun. 2025;14(2):36-46. doi: 10.11648/j.ajnc.20251402.12

    Copy | Download

  • @article{10.11648/j.ajnc.20251402.12,
      author = {Kumilachew Chane},
      title = {Reliability Assessment of Distribution Network for Improved Feeder Bule Hora University, West Guji, Oromiya Regional State, Ethiopia
    },
      journal = {American Journal of Networks and Communications},
      volume = {14},
      number = {2},
      pages = {36-46},
      doi = {10.11648/j.ajnc.20251402.12},
      url = {https://doi.org/10.11648/j.ajnc.20251402.12},
      eprint = {https://article.sciencepublishinggroup.com/pdf/10.11648.j.ajnc.20251402.12},
      abstract = {The knowledge of the reliability of distribution networks and systems is important consideration in the system planning and operations for development and improvements of power distribution systems. To achieve the target as minimum interruptions as possible to customers, utilities must strive to improve the reliability but at the same time reduce cost. It is a known fact that most of customer interruptions are caused by the failure in distribution system and the data and statistics were not easy to collect the reliability performance. The objective of the study was to examine the reliability distribution of networks and systems in the study area. In terms of methods, these studies used analytical methods to determine the reliability indices and effect of distribution substation configuration and network to the reliability indices performance. The key findings showed that there is always uncertainty associated with the distribution network reliability in the study area. The authors concluded that for evaluation and analysis of reliability, having data on the number and range of the examined piece of equipment, it is important to have database for failure rates, repair time and unavailability for each component in distribution network. Finally, the authors recommended that in order to improve the present status of the reliability distribution of network for improved feeder, training of workers, experts and customers strategies are very necessary. So that planners, policy makers, local communities, stakeholders and households need strong coordination to achieve the objective.},
     year = {2025}
    }
    

    Copy | Download

  • TY  - JOUR
    T1  - Reliability Assessment of Distribution Network for Improved Feeder Bule Hora University, West Guji, Oromiya Regional State, Ethiopia
    
    AU  - Kumilachew Chane
    Y1  - 2025/07/28
    PY  - 2025
    N1  - https://doi.org/10.11648/j.ajnc.20251402.12
    DO  - 10.11648/j.ajnc.20251402.12
    T2  - American Journal of Networks and Communications
    JF  - American Journal of Networks and Communications
    JO  - American Journal of Networks and Communications
    SP  - 36
    EP  - 46
    PB  - Science Publishing Group
    SN  - 2326-8964
    UR  - https://doi.org/10.11648/j.ajnc.20251402.12
    AB  - The knowledge of the reliability of distribution networks and systems is important consideration in the system planning and operations for development and improvements of power distribution systems. To achieve the target as minimum interruptions as possible to customers, utilities must strive to improve the reliability but at the same time reduce cost. It is a known fact that most of customer interruptions are caused by the failure in distribution system and the data and statistics were not easy to collect the reliability performance. The objective of the study was to examine the reliability distribution of networks and systems in the study area. In terms of methods, these studies used analytical methods to determine the reliability indices and effect of distribution substation configuration and network to the reliability indices performance. The key findings showed that there is always uncertainty associated with the distribution network reliability in the study area. The authors concluded that for evaluation and analysis of reliability, having data on the number and range of the examined piece of equipment, it is important to have database for failure rates, repair time and unavailability for each component in distribution network. Finally, the authors recommended that in order to improve the present status of the reliability distribution of network for improved feeder, training of workers, experts and customers strategies are very necessary. So that planners, policy makers, local communities, stakeholders and households need strong coordination to achieve the objective.
    VL  - 14
    IS  - 2
    ER  - 

    Copy | Download

Author Information
  • Abstract
  • Keywords
  • Document Sections

    1. 1. Introduction
    2. 2. Materials and Methods
    3. 3. Results and Discussion
    4. 4. Conclusion and Recommendation
    Show Full Outline
  • Author Contributions
  • Funding
  • Data Availability Statement
  • Conflicts of Interest
  • References
  • Cite This Article
  • Author Information